Worth a Closer Look
Full-resolution spectrograms you can actually zoom into, vessels on the map, and a Marlin Connect rebuilt from scratch.
In Make Some Noise we opened the hood on the listening and the thinking, and in Reading the Room we put it to work on a wind farm. Marlin v3.0 is about the other half of the job — actually looking at what came back. Four things changed.
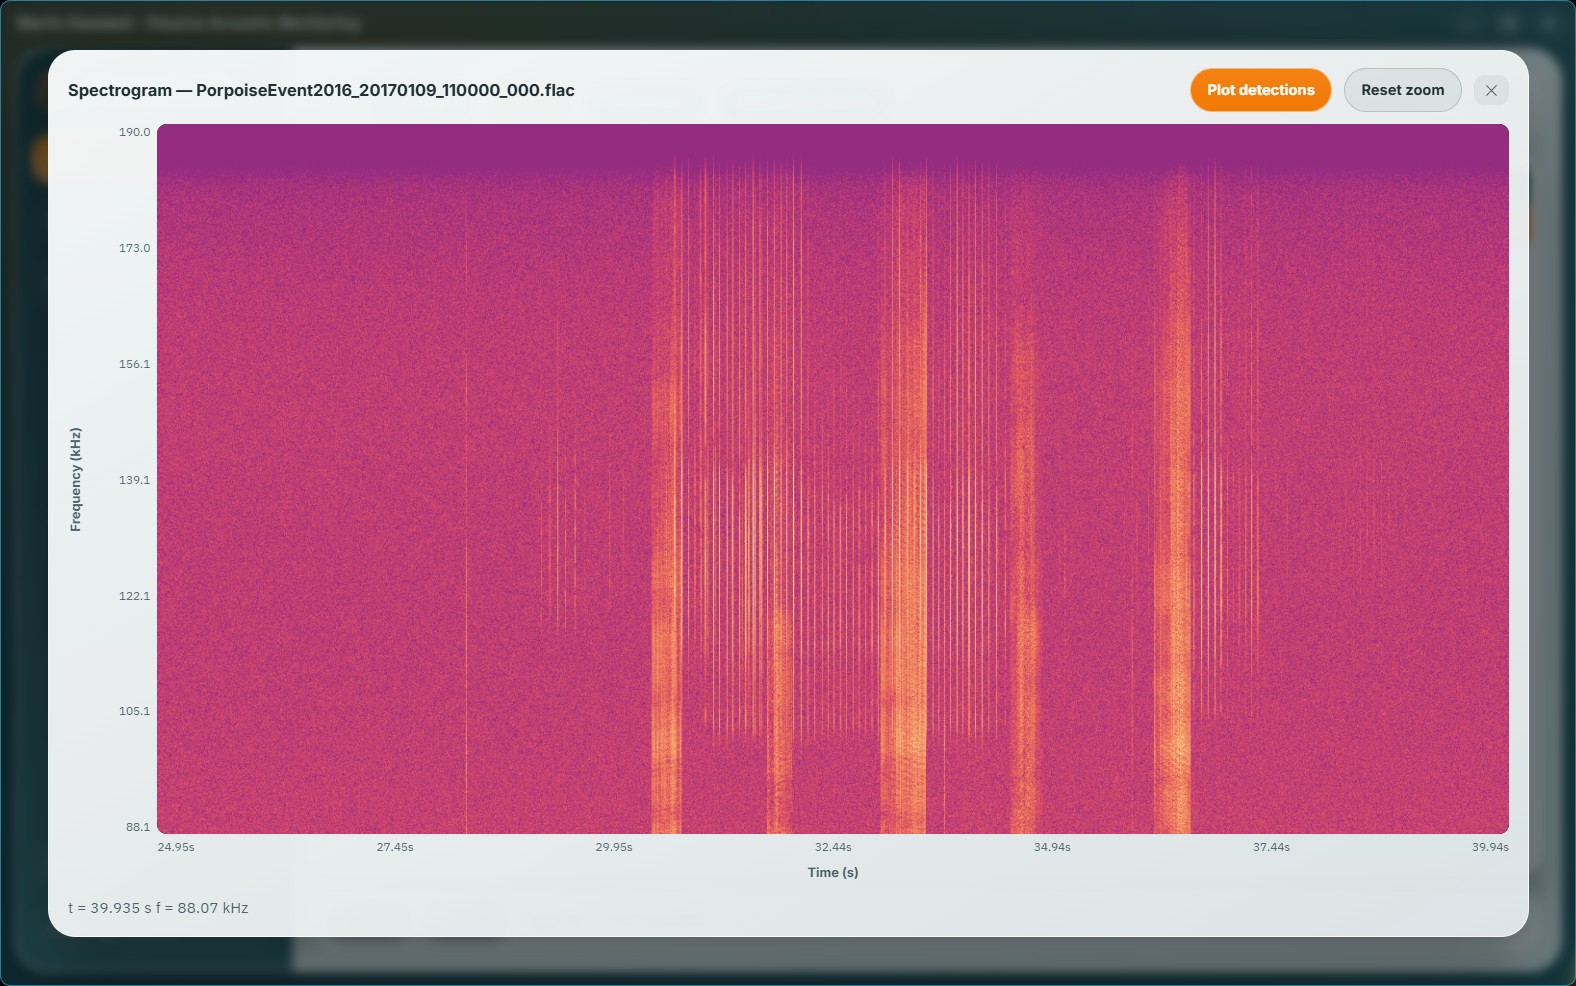
“Zooming should never just magnify the pixels you already have. It should re-render the spectrogram within the time and frequency bounds you chose — a new, high-resolution view of the underlying data.” — Field notes, Marlin team
You can trust what you're looking at
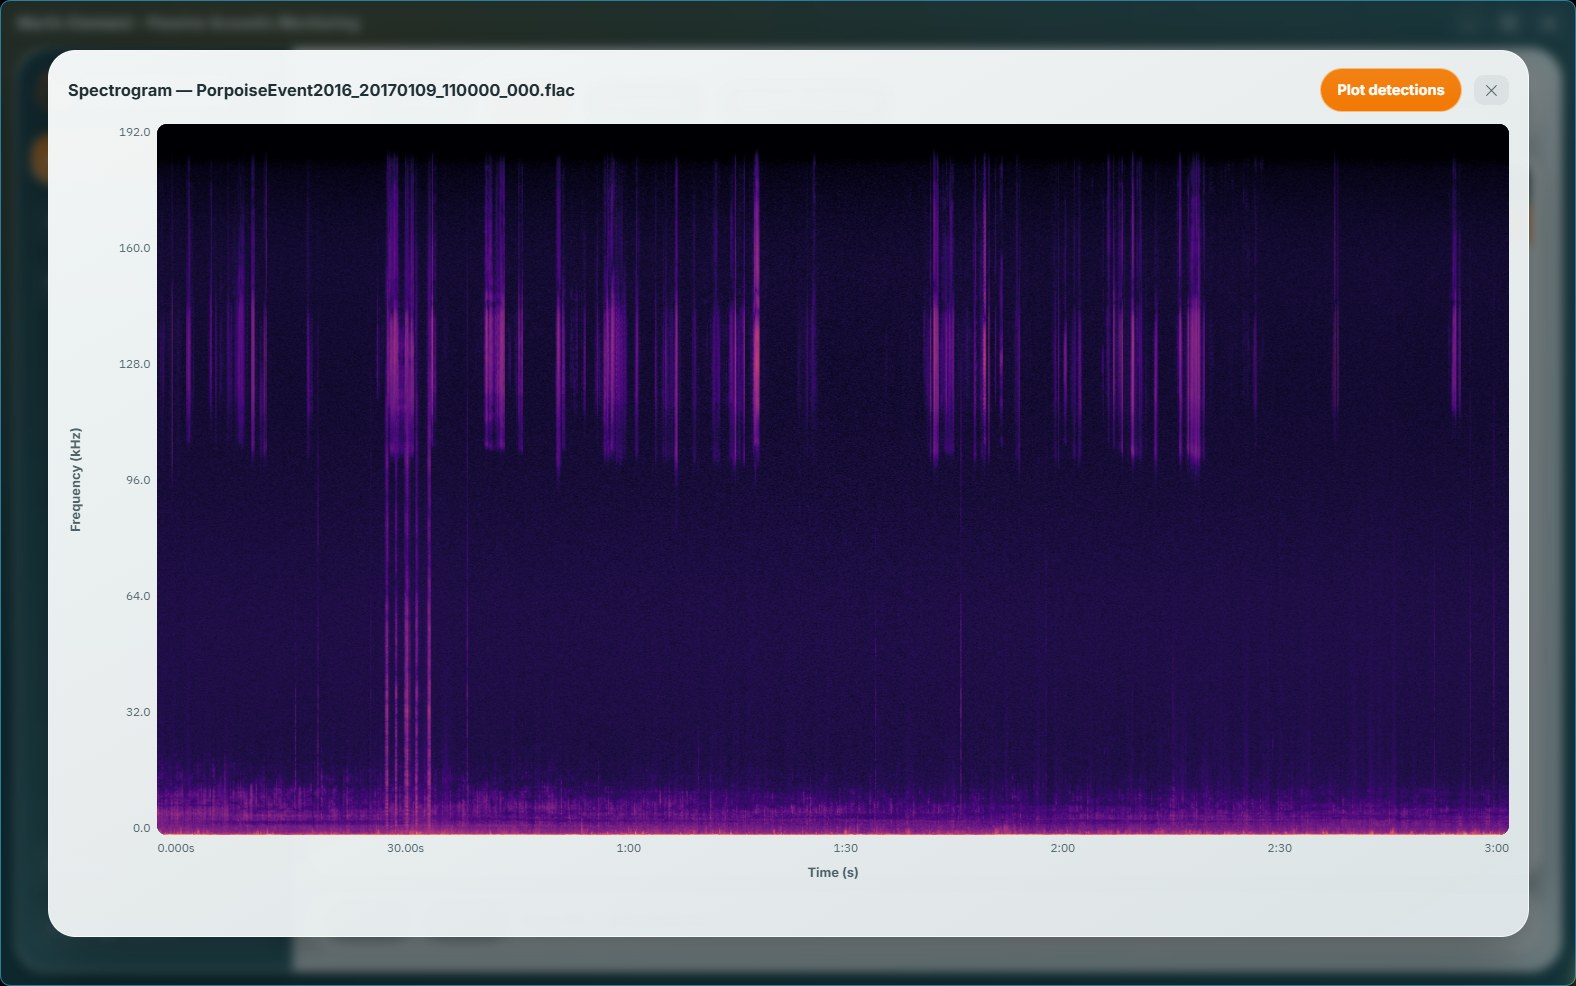
Detail is only useful if it survives the trip to your screen. So in v3.0 we rebuilt the plotting end of the pipeline: the analysis runs at full resolution, every frequency bin is kept, and when a long recording has to be fitted into a finite view, time columns are merged peak-first rather than dropped. The quiet consequence is a picture you can rely on — a single click or a brief tonal is still there to be found, because nothing was thrown away to draw it faster.
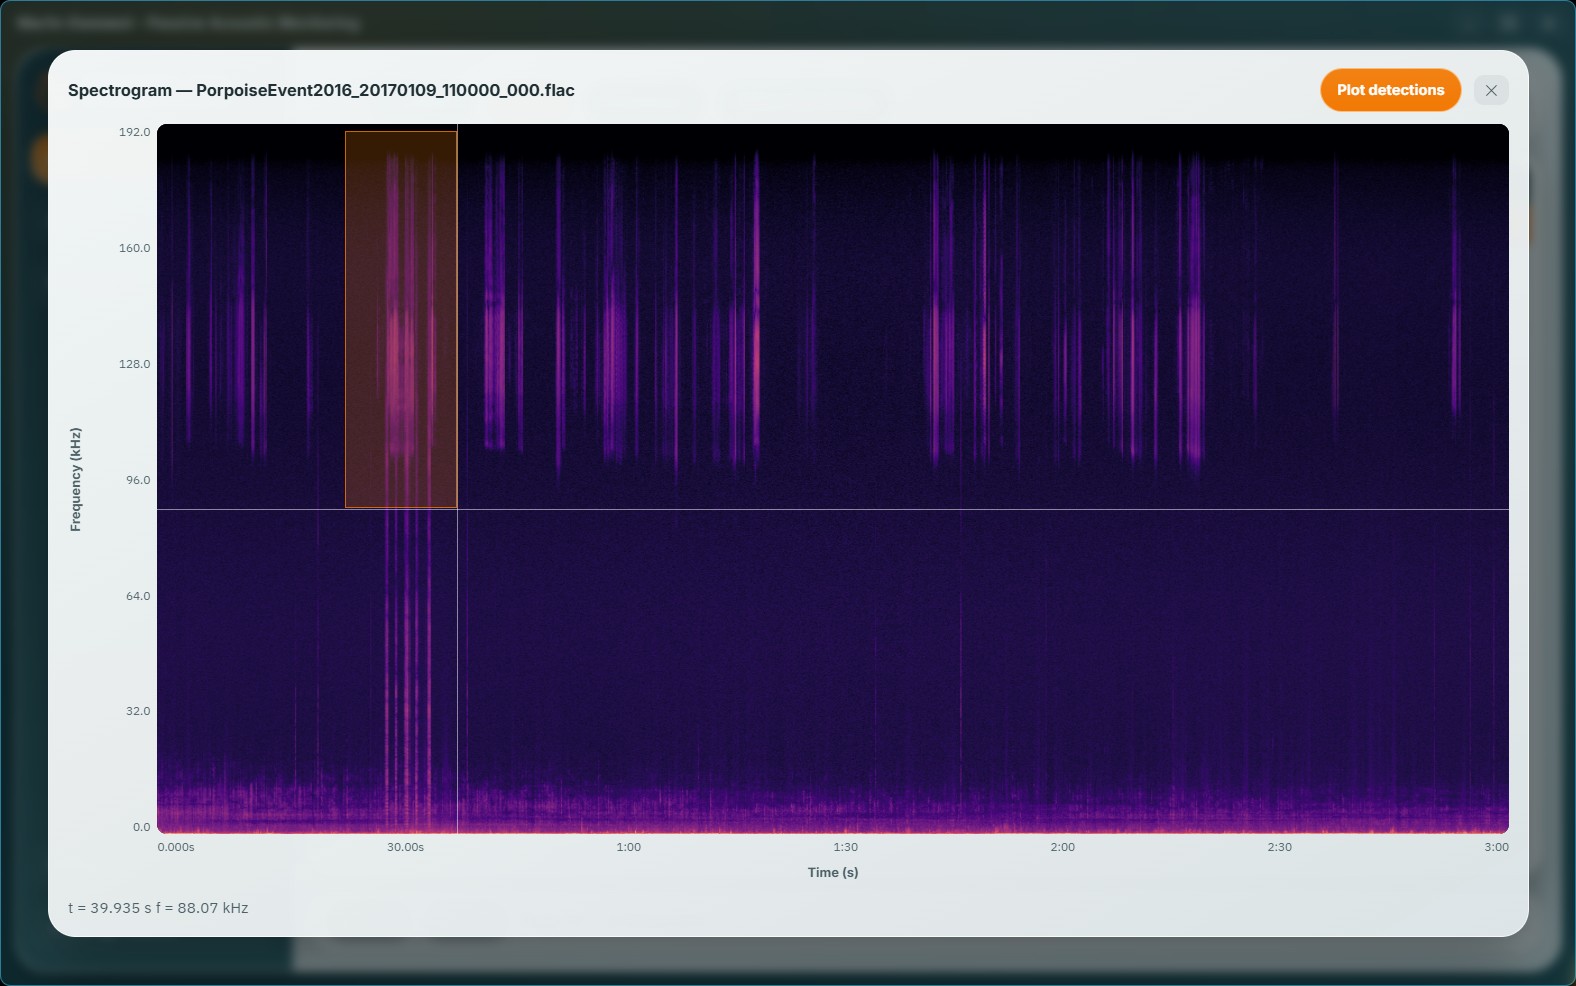
Then there's the zoom, which is the part that matters. Drag a box and Marlin goes back to the original audio and re-computes that window from scratch. It's a genuine re-plot of the region you asked for, not an image zoom. Drag wide and short for a stretch of time, tall and narrow for a band of frequency, or a box for both. Reset zoom puts the full view back.
Hover anywhere for a time and frequency readout. Multi-channel file? Pick your channel. Detections alongside the audio? They overlay on top. And you can export exactly what's on screen — PNG, CSV or HDF5.
What else was out there
A loud, unexplained event in the audio is only half a story. The other half is what was floating above it.
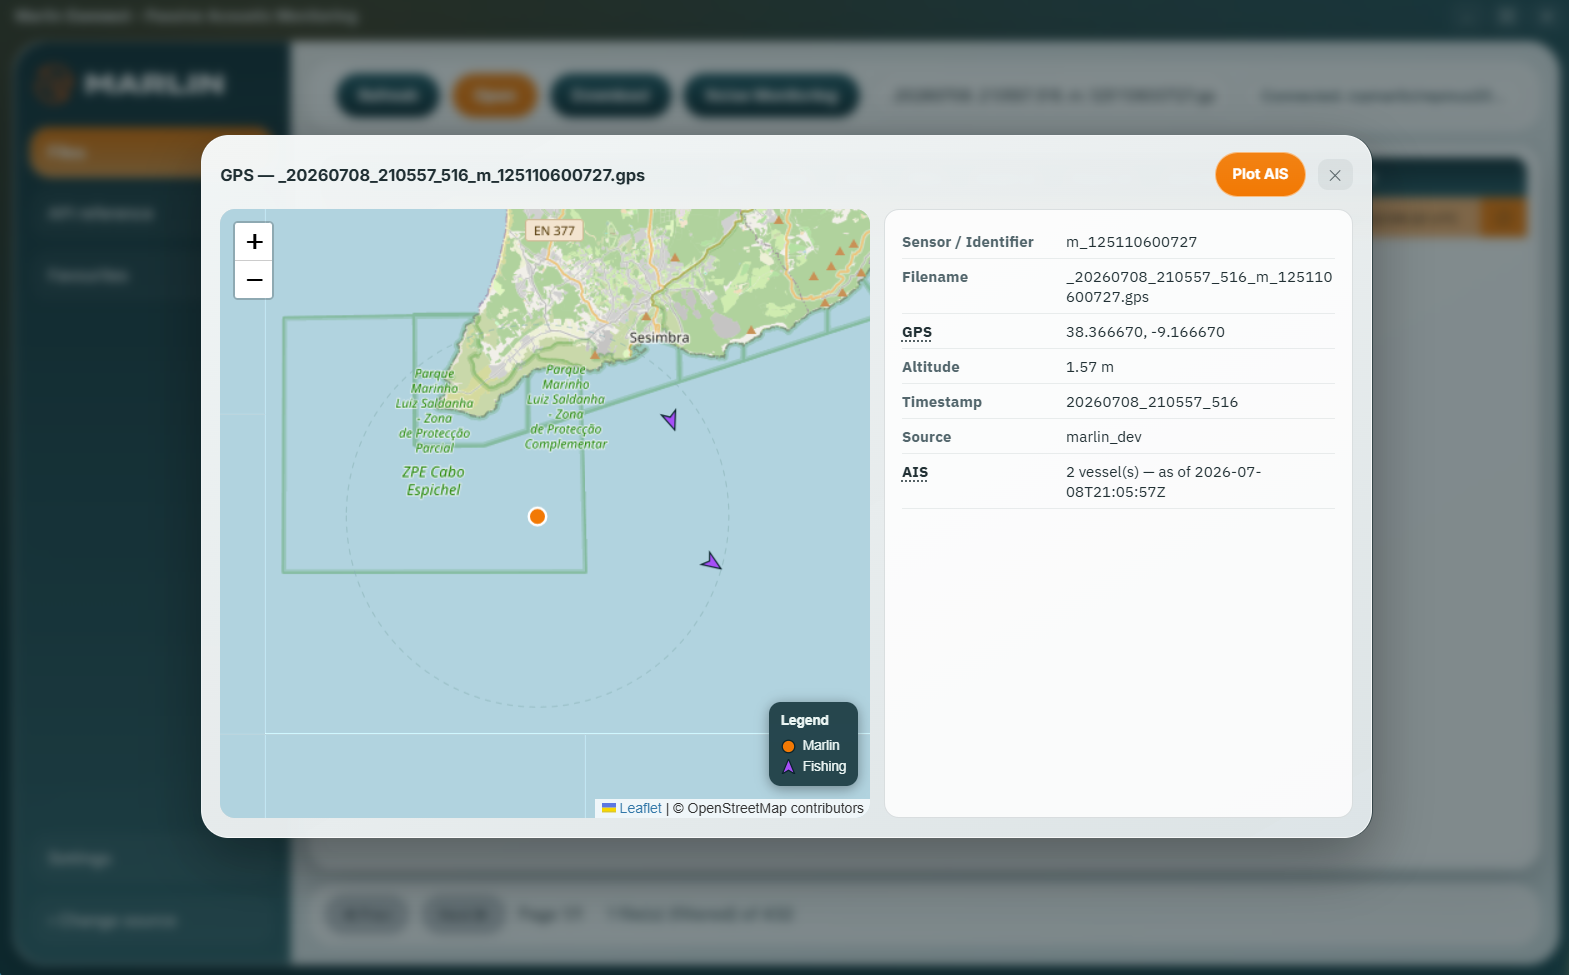
Marlin devices can now take a snapshot of the vessels around them, once per recording, from a commercial AIS feed — and it's time-locked to the start of the clip. That matters more than it sounds. The vessel picture describes the same minute of audio you're looking at, rather than drifting along on a clock of its own. The snapshot travels with the clip's position data, so it's still there weeks later when you finally open the file.
In Marlin Connect, Plot AIS puts those vessels on the map, coloured by type, with a legend and a popup per vessel. Centre the map on the sensor, or on the traffic around it. It pairs naturally with the anomaly detection from Reading the Room: something didn't fit the baseline — and here's the trawler that was sitting on top of it.
It's optional, off unless you configure it, and it never blocks or slows a recording.
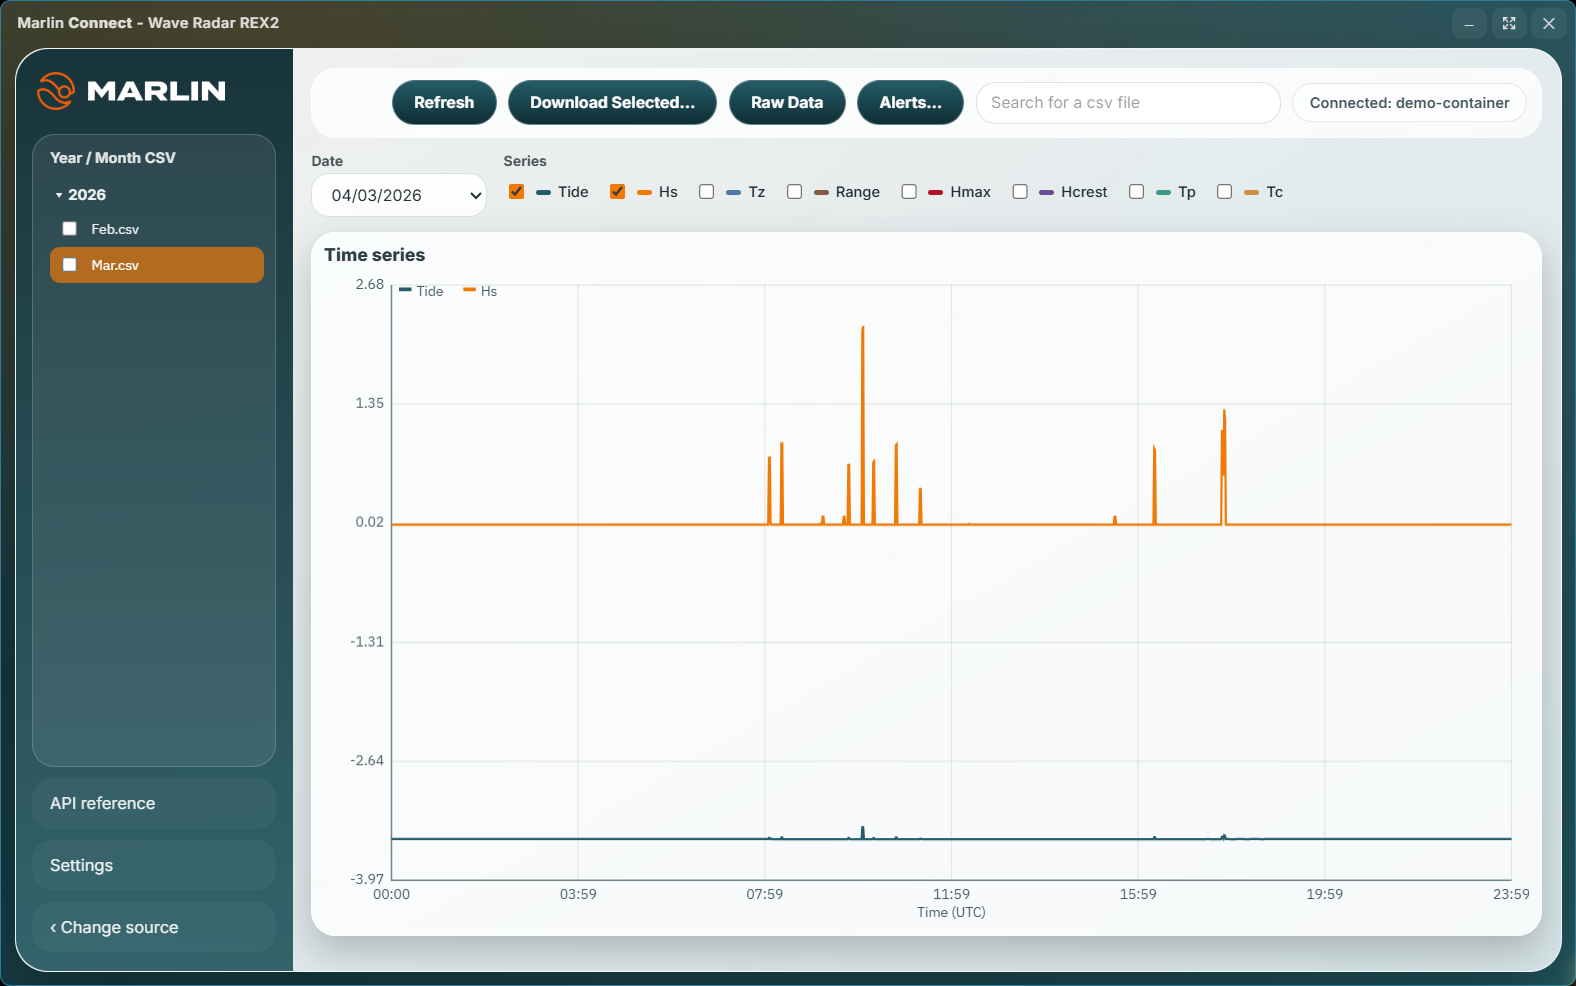
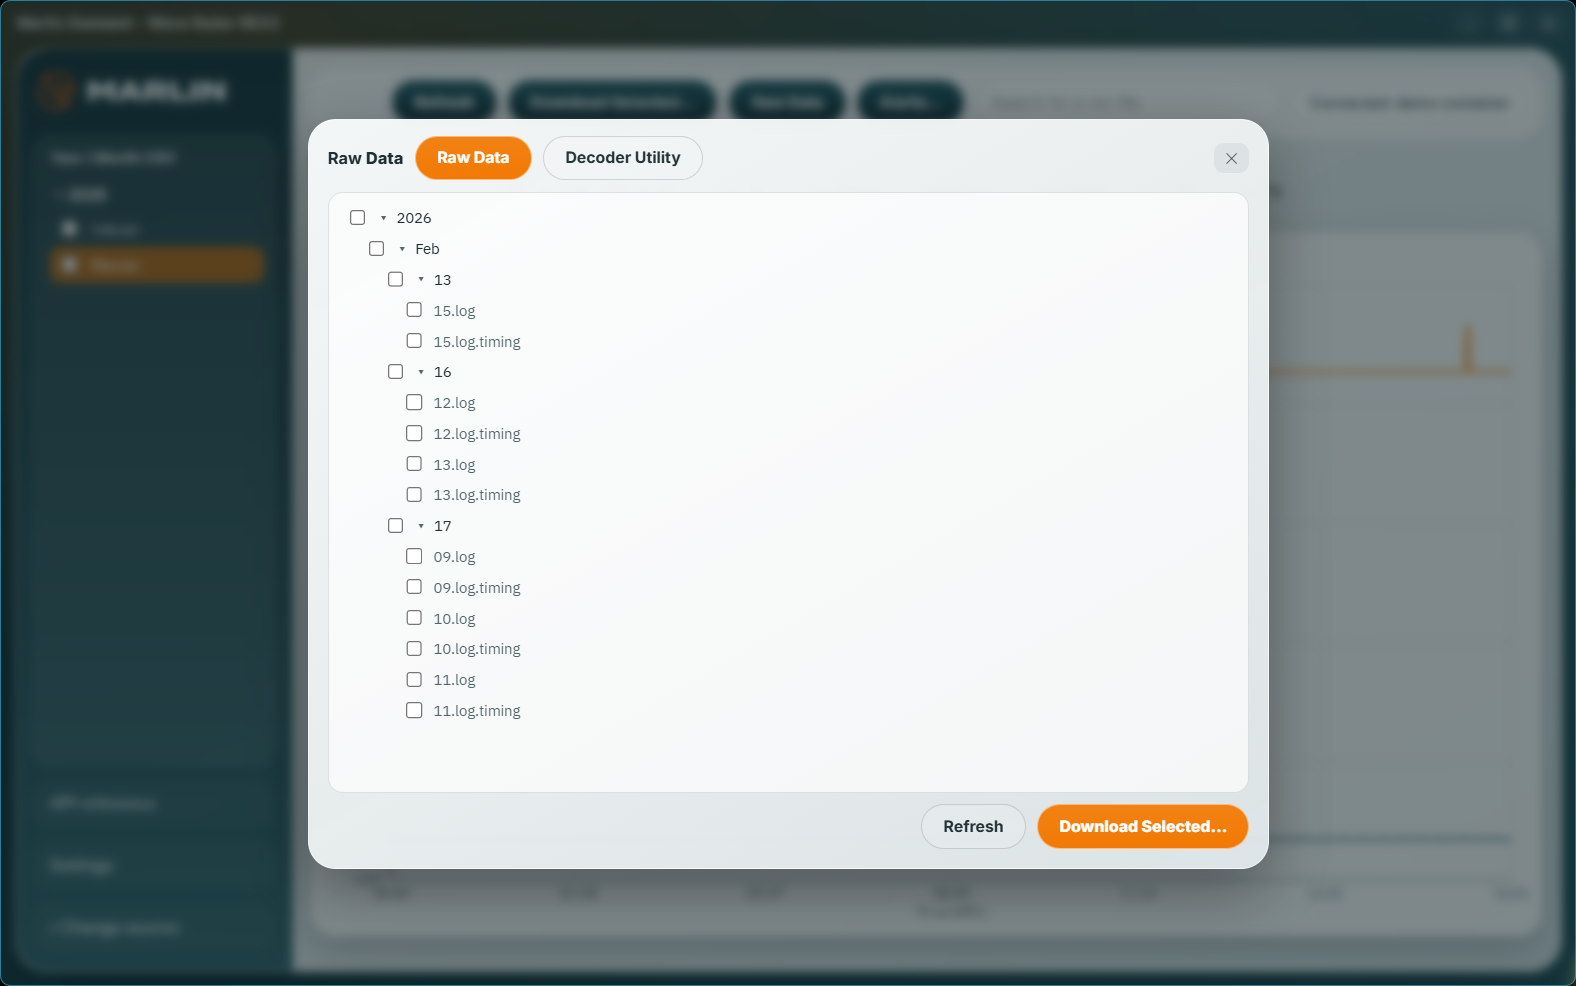
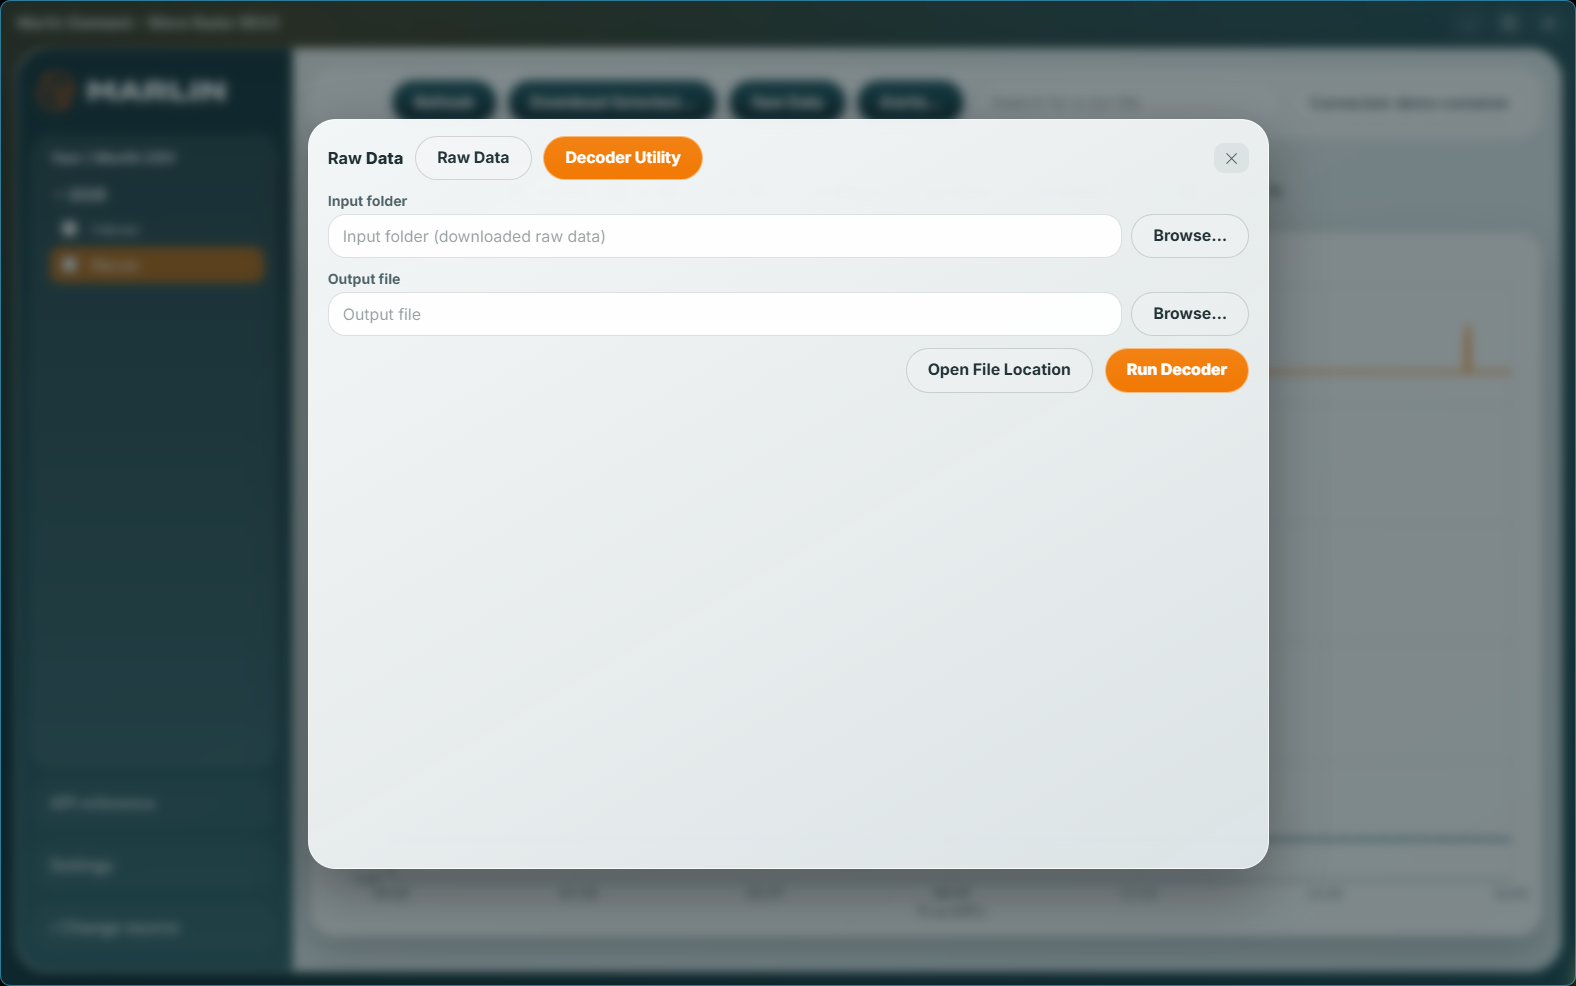
Raw data, without the scavenger hunt
Connect a Wave Radar REX2 and Marlin opens in REX2 mode: browse the monthly wave and tide data, plot the series you care about on an interactive chart, set an alert on a wave parameter and get told when it's crossed.
New in v3.0 is everything underneath that. The raw-data archive is now browsable in the app — a folder tree you can walk through, ticking the files you want and pulling them down from your own container, on demand. Nothing ships with the app and nothing is fetched until you ask for it.
And the decoder is finally built in. It's a Decoder Utility panel in the REX2 window: point it at a folder of raw data you've downloaded, run it, and it writes out the decoded file — Open File Location takes you straight to it. The decoder itself is not new; what's new is that it lives inside Marlin Connect and is resolved from within the app, instead of being a loose executable that had to sit in the right place next to the launcher. One window, one workflow, no scavenger hunt.
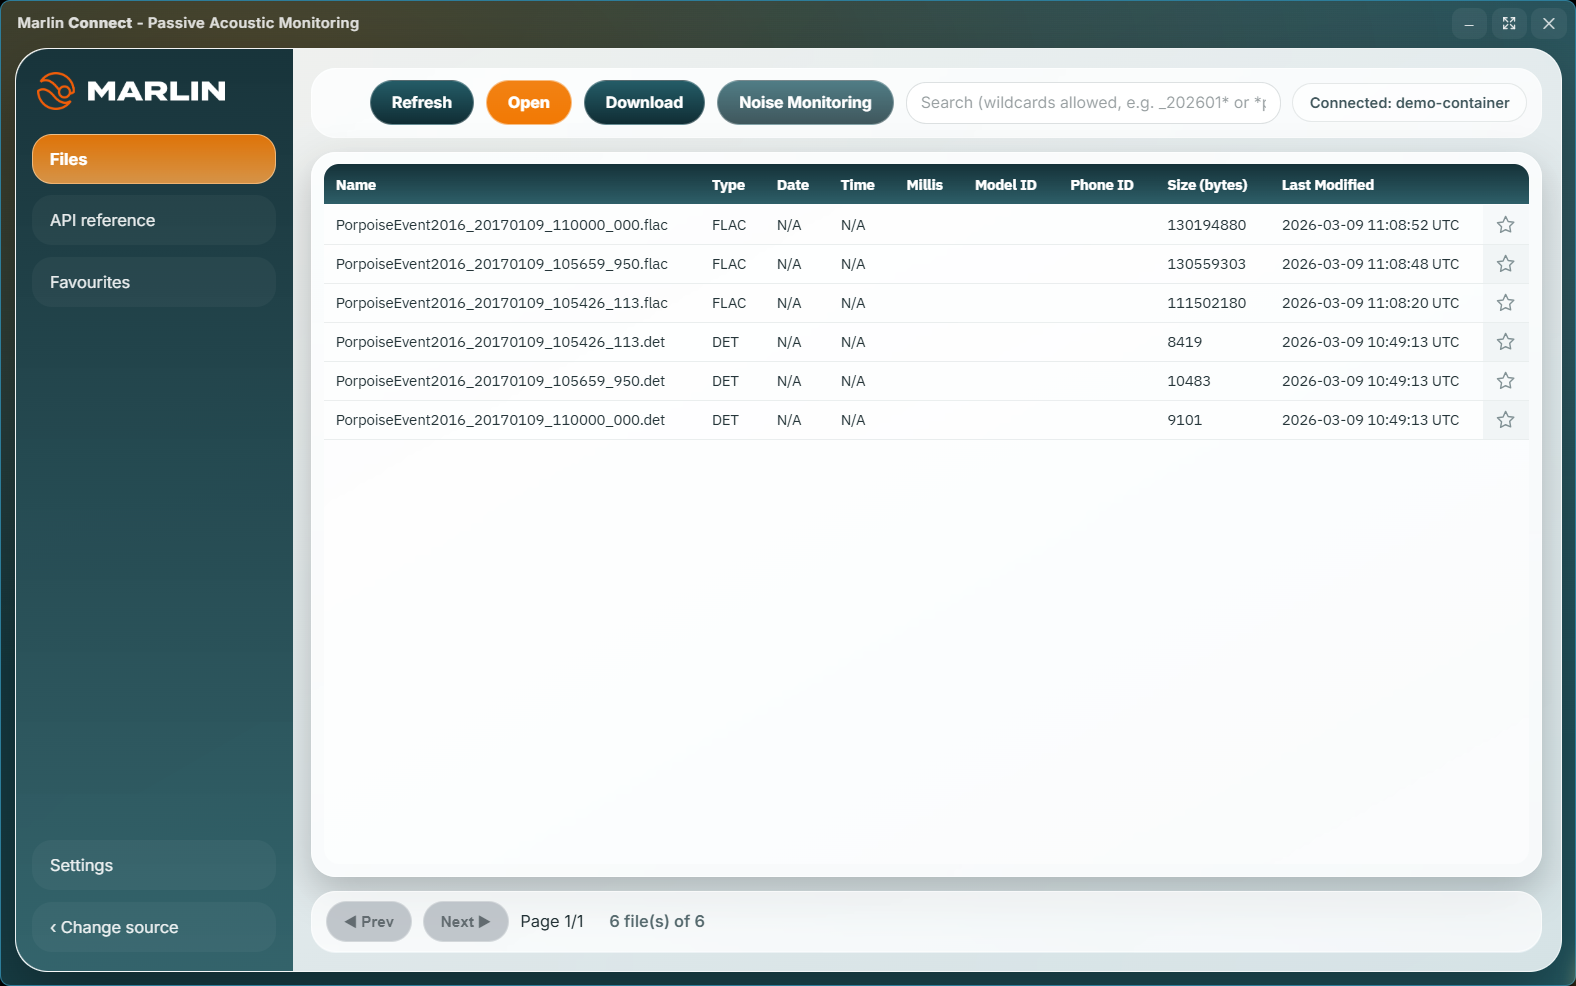
Rebuilt, not redecorated
v2 was a set of separate windows stacked on an ageing desktop toolkit. v3.0 is a full rewrite: one native app, one window, one place to work, with a modern glass interface on top and the heavy science running underneath — so the analysis never freezes the thing you're clicking on.
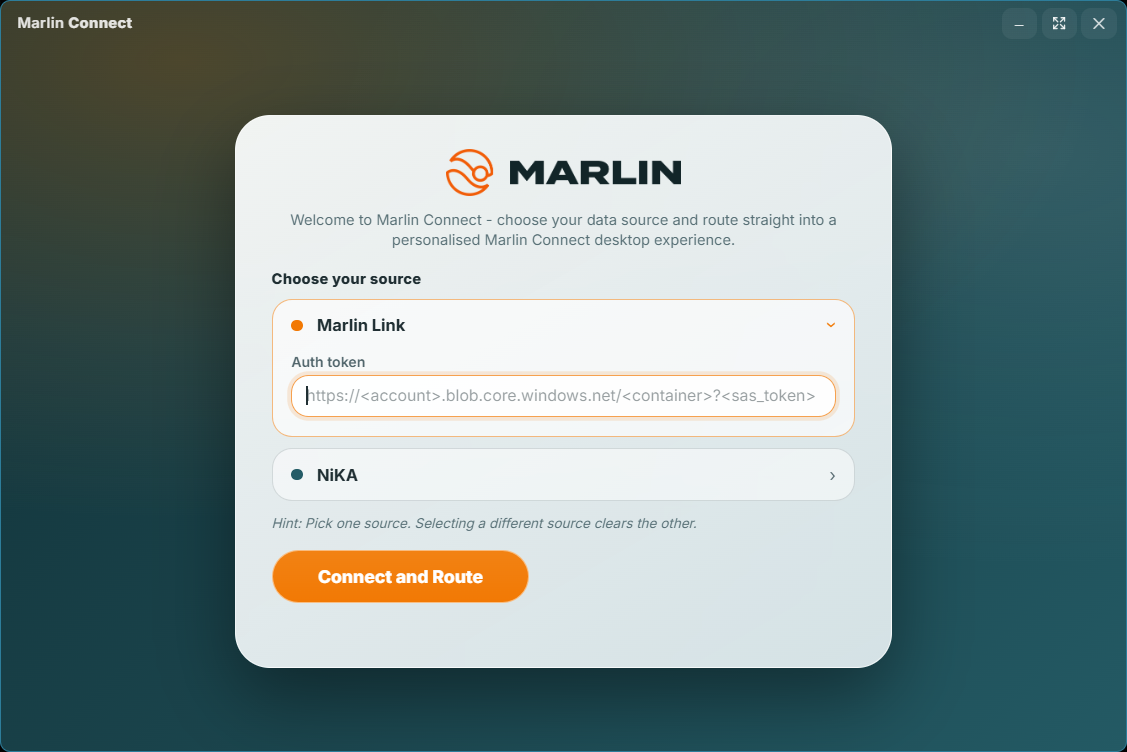
Connect once and Marlin routes you into the right mode for your system. From there, the small things that make a long day shorter:
- Starred files, kept per data source — the recordings you keep coming back to, one click away.
- Search and sort that hold up across a file list with thousands of entries in it.
- Auto-reconnect to your most recent source on launch — and a Cancel button, for when that's not where you meant to go.
- Spectrogram export, and a background mode that keeps monitoring and alerting from the system tray while you get on with something else.